Gateway to the future

Blog

Is Really No Coding Required in Data Analysis?

In today's rapidly growing digital landscape, data analytics have emerged as a critical component of decision-making processes across various industries. The landscape of data analysis has evolved, sparking the question: Is coding truly unnecessary? With advancements in technology, there's a growing array of user-friendly tools that minimize, and sometimes eliminate, the need for extensive coding. In this article, we will delve into the world of data analysis, explore the technologies integral to this field, discuss its scope, and provide insights into learning data analysis.

The Work of Data Analyst

A data analyst is a professional responsible for collecting, processing, and interpreting data to help organizations make informed decisions. They work with raw data to uncover valuable insights, trends, and patterns that can influence a company's strategies and operations. Data analysts are proficient in various tools and techniques, enabling them to transform data into actionable information. The impact of a skilled data analyst can be substantial. They can identify market trends, customer preferences, and potential areas for business growth. Their work informs marketing campaigns, product development, and overall business strategies.

Technologies Used in Data Analysis

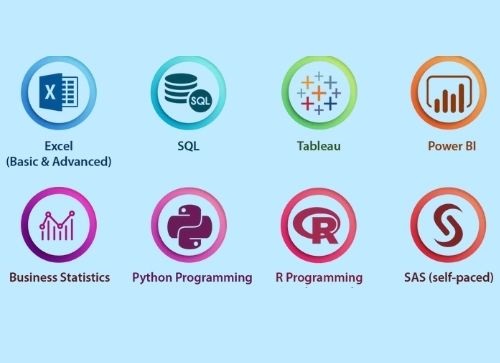
In today's data analytics, user-friendly interfaces on modern platforms streamline complex tasks without intricate coding. These graphical interfaces simplify data manipulation, statistical analysis, and visualization. While coding isn't mandatory, a foundational understanding of languages like Python or R enhances flexibility for diverse datasets. Key tools include Python and R for efficient data work, along with Excel, SQL, Tableau, and Power BI for processing and presenting data. The rise of machine learning and artificial intelligence enables analysts to predict future trends based on historical data.

Certainly! Here are the details of the key technologies and tools used in data analysis:

Python

Python is a widely embraced programming language in data analysis due to its user-friendly nature, which accommodates both beginners and seasoned programmers. Its strength lies in its extensive library ecosystem, including tools like Pandas, NumPy, and Matplotlib, which streamline data manipulation, statistical analysis, and visualization tasks. Furthermore, Python's vibrant community of developers and data analysts offers ample documentation, tutorials, and resources, ensuring efficient problem-solving and staying current with data analysis advancements.

R

R is a favored programming language for data analysis, renowned for its statistical prowess and visualization capabilities. It's a top choice among statisticians and data scientists due to its extensive range of statistical functions and packages. Additionally, R excels in data visualization, offering tools like ggplot2 for crafting customizable and visually appealing charts and graphs. Like Python, R benefits from a thriving community that consistently produces and updates packages, simplifying intricate data analysis tasks for analysts.

Excel

Microsoft Excel is a widely embraced spreadsheet application integral to data analysis. Its user-friendly interface caters to users of all levels, often serving as the initial tool for basic data analysis. Excel's functionalities include data manipulation through functions and formulas, enabling tasks like sorting, filtering, and calculations on data sets. While not as advanced as dedicated data visualization tools, Excel offers basic charting and graphing capabilities for visualizing data. Additionally, its seamless integration with other Microsoft Office applications and databases makes it a convenient choice for organizations already immersed in the Microsoft ecosystem.

SQL

Structured Query Language (SQL) is indispensable for managing relational databases housing structured data. SQL facilitates data retrieval, querying, and manipulation within databases like MySQL, PostgreSQL, and Microsoft SQL Server. It's a valuable tool for filtering data based on specific criteria, enabling the extraction of pertinent information from extensive datasets. SQL also supports data transformation tasks, including aggregations, joins, and calculations, empowering analysts to extract meaningful insights from the data. Moreover, SQL databases are renowned for their robust security features, making them a secure choice for handling sensitive information.

Data Visualization Software
(Tableau, Power BI, etc.):

Tableau:

Tableau is a important data visualization tool that allows users to produce interactive and shareable dashboards. It can connect to various data sources, making it suitable for data analysts to explore and present data effectively.

Power BI:

Microsoft Power BI is another popular data visualization tool that provides capabilities for data modeling, interactive reporting, and sharing insights. It integrates seamlessly with other Microsoft products, making it a preferred choice for many organizations.
These technologies and tools, each with its own strengths and use cases, are essential for data analysts to effectively collect, analyze, and present data in a comprehensible manner, thereby facilitating data-driven decision-making.

Scope of Data Analysis

The scope of data analysis is expanding rapidly. Businesses in nearly every industry are recognizing the value of data-driven decision-making. As a result, there is a growing demand for skilled data analysts. From healthcare to finance to e-commerce, opportunities abound for those well-versed in data analysis.

Job prospects in this field are promising, with positions like Data Analyst, Business Analyst, and Data Scientist in high demand. These roles offer competitive salaries and opportunities for career advancement. As data continues to play a pivotal role in shaping business strategies, the scope of data analysis remains robust.

Learning Data Analysis

In our ever-evolving world, mastering data analysis is a valuable skill, and Nass Technologies offers the perfect opportunity to acquire it. At Nass Technologies, we provide comprehensive data analysis training in Nagpur, equipping you with the knowledge and practical skills needed to excel in this field. Our training program encompasses a range of essential topics, including programming languages, data manipulation, statistical analysis, and data visualization.

However, we believe in practical learning rather than just theory. That's why we provide you with real-world projects that allow you to apply what you've learned in a practical setting. When you choose Nass Technologies for your data analysis journey, you're not just getting an education; you're gaining the confidence and expertise to thrive in a data-driven world. Join us today and take the first step toward a successful career in data analysis in Nagpur.

Conclusion

Data analysis is a dynamic field with a broad scope and significant career potential. As businesses continue to rely on data for decision-making, the role of data analysts becomes increasingly vital. Ultimately, the landscape is shifting towards making data analysis more accessible to non-programmers, but the extent to which coding is required depends on the specific tools used and the complexity of the analysis at hand. Learning data analysis, particularly through courses provided by Nass Technologies, can lead to a promising and fulfilling career.

Back to Blog Page

Other Menus

Social Media